Digital data controls have become de rigueur for water utility operations. In the early days, Supervisory Control and Data Acquisition (SCADA) systems had to be hard-wired to equipment. Then, utilities moved to Geographic Information System (GIS) platforms which provide schematics and locations of their water and sewer systems. Now management control systems overlay both SCADA and GIS digital platforms.
According to Gigi Karmous-Edwards, with Amane Advisors, and Will Sarni, founder and CEO of Water Foundry, writing in Water Finance and Management (June 11, 2018 issue), this process of overlaying applications was made possible with the creation of application programming interfaces (APIs), allowing programs to retrieve data from any software application as the profiles of companies and utilities below reveal.
Software applications across utilities can use APIs to access the needed data from existing legacy systems, sensors, and other applications regardless of data location, the authors explain. Continuing, they point out that today, utilities mainly use hydraulic models for planning and expanding purposes once every few years. Eventually, they predict, future utilities will use real-time hydraulic modeling with real-time sensor data input instead of mathematical assumptions to accurately simulate the live utility operations.
Asset management—the practice of managing the life cycle of infrastructure capital assets—is also a significant trend, the authors point out. As can be seen with the profiles below, utilities are recording every asset within their GIS system. Every recorded asset also contains structured and unstructured data (videos, photographs) from across all departments for insights to decrease costs and risks. There, management and field workers, in some cases, have access to the data, allowing them to make decisions usually in real time.
In the profiles that follow, all software platforms provide certain basic tools: integration with ArcGIS, assignment of chosen assets to identifiers, automatic reporting, and work orders generated. Differences include how the companies describe their products and what specialties they choose to offer.
The companies profiled—beginning with Utility Cloud and Cartegraph—illustrate these differences. They represent the new and the established in asset management platforms.
MANAGING COMPLIANCE
Utility Cloud CEO Mark Moreau defines his company as “an operations compliance and management platform giving customers simple alternatives” on which to assign and manage scheduled and unscheduled work on specific or entire classes of assets for inspection, maintenance, and cleaning.
The company started up in 2002 as a consulting firm and reorganized in 2011 as a software company, says Moreau, making it one of the newest companies profiled here.
Utility Cloud’s software platform is based in the cloud, as the name indicates. It allows for easy search, inspections, and repairs of the water utility’s assets and it offers regulatory compliance notifications and forms, allowing compliance reports to be triggered automatically or manually. Authorized users may make changes through the administrative setup, unlike other systems that require a user to pay for that service.
The platform allows customers to create needed compliance forms and to store them in the cloud where they can be shared with other customers. It’s like crowdsourcing, says Moreau. The sharing works especially well with small towns that have limited resources.
An example is the online protocol for managing inspections for food, oils, and grease (FOG). Inspection forms that include work history, once the inspections are complete, will automatically produce reports and work orders.
Moreau explains that Utility Cloud built a system with specific solutions for maintenance data by connecting SCADA with the platform to incorporate the data into it. This allows management and regulatory reporting to be more accurate. It also has an early warning system, as Moreau describes it. Anything, any piece of equipment logged into Utility Cloud can immediately and automatically be flagged with a suspected issue and automatically generate a work order for an upstream investigation by a repair crew.
Utility Cloud’s platform seems well-suited for water utilities who don’t have the information technology staff to manage a GIS system. While Utility Cloud can fully integrate a utility’s GIS data into its platform, it can also provide its own geospatial data using Google Maps. Utility Cloud also integrates Cityworks and Excel into its platform.
The platform also works offline, Moreau says. If utility workers won’t have access to online work in the field, or if they lose connectivity, the system will allow them to continue to use their smart phone or tablet for work.
Moreau says the company has a wide range of customers, from Exxon Mobil to the smallest utility. He says that while Utility Cloud’s resources are suited for all company sizes, the average size of a utility customer ranges from medium to small.
White House Utility District technicians use data from OSIsoft in the field while searching for a leak.
TRACKING INFRASTRUCTURE ASSETS
Cartegraph’s Operations Management System (OMS) is an asset and work management system allowing a water utility or municipal government to track all infrastructure assets, their attributes, and history, according to Quint Pertzsch, solutions engineer manager at Cartegraph.
Cartegraph started up in 1994 with a legacy, server-based product installed on all of a client’s machines, says Pertzsch. Recognizing that the industry wanted a web-based platform, it developed OMS. It has been available since 2012. Customers go to a URL to install the system for every machine and mobile device in the facility. It is scalable and can be adopted by any municipal department.
Cartegraph’s OMS software integrates easily with ArcGIS (Geographic Information System) and SCADA. It allows utility staff to track all infrastructure assets, from pipes and values to pumps and hydrants installed in the software. Attributes, work activities, and costs are assigned to each pump, fire hydrant, and pipe. Costs can then be tracked over the lifespan of each asset. Pertzsch says OMS’s integration of all SCADA alarms allows the software to automatically create a work order and load it into the staff’s desktop or mobile device where they can view and complete the work.
In most cases, OMS can integrate legacy information into the software to provide the cradle-to-grave history of assets, says Pertzsch. Older utilities with limited histories of their assets can also be accommodated in the software. “We have predictive analytics based on the installation date of the asset,” says Pertzsch. “If the equipment went into the ground in 1980, we have a good idea of its lifetime,” he adds.
A White House Utility District water loss analyst views OSIsoft’s PI software platform which helped the utility district save $500,000 in 2016.
Cartegraph’s preventive maintenance tools allow the utility to create recurring tasks to keep the assets living longer. Pertzsch explains, “Organizations are reactive and want to be proactive or they are already proactive and want to stay that way to increase productivity.”
If a utility does not have GIS, the only requirement, Pertzsch says, is that each asset must have a unique identifier, but some data collections don’t have the granularity necessary for OMS. Cartegraph has an application to collect the basic information needed, such as spatial location, details of installation, and dates for each asset.
Using this data, preventive maintenance schedules can be built and made available on computer screens and mobile devices. OMS creates sets of triggers to send to workers. The messages may read, “Inspect hydrants at First and Main,” explains Pertzsch. The worker takes a picture of the hydrant and writes notes on his or her iPad or mobile device. Once the information is saved, it can be accessed by the back office and can be included in reports generated to itemize the number of inspections made and how many are left to do. These reports are available through searches on the software site and can be used for future decision-making.
Pertzsch says the integration of OMS and GIS is bidirectional. “If I have a layer of fire hydrants in GIS and update that information, it will automatically change in Cartegraph’s software,” he says. “No more double entries.” When the software is updated on the street after an inspection, GIS data is also automatically updated, he explains.
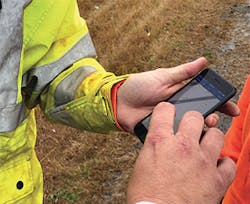
Cartegraph has two mobile applications for smartphones and iPads—iOS and Android. While on the job, crews use the smart phones or iPads to view assignments and enter information, including pictures and videos of the asset before and after repair, dated and time-stamped. The information is automatically attached to the asset. Meanwhile, if the worker sees a problem with a bus stop or gutter, he can take a picture and send it to the appropriate department to take care of.
Cartegraph OMS software can be extended to any department responsible for asset or work management and this has advantages for cross-department efficiency and collaboration, Pertzsch points out. “Once an organization owns the software, any user can use it. From an organization’s standpoint, you don’t need different software for different departments.” Access can be controlled centrally under a permission regime controlled by a system administrator.
The efficiency is apparent from the start. If the water department has plans to replace a water line in two years, and the street department wants to replace asphalt in the same area in the next year, the two departments can coordinate the activities, saving the organization money from having the street dug up a year after it was replaced.
Cartegraph OMS also has capital improvement planning tools allowing a department to create long-term budgeting plans through the Scenario Builder advanced feature. Pertzsch offers an example: “If you know you have $5 million to spend on maintenance activities over the next five years, which work should be prioritized and how will that work impact the condition of your assets?” Good data is needed to effectively create these proactive plans, so the key is to have accurate data in the system in order to efficiently generate capital improvement plans, he concluded.
MANAGEMENT & CAPITAL PLANNING
Innovyze was founded in 1996. It is a global provider of wet infrastructure business analytics software designed for a wide range of clients. It does business throughout all five continents.
Innovyze develops and supports GIS-centric infrastructure modeling and design technology. The company has a product portfolio that stretches from water distribution, wastewater, stormwater, river, and floodplain modeling to asset management and real-time analytics.
Innovyze’s major software platforms are InfoWater, a GIS-integrated software application for water distribution modeling and management software, and InfoWorks ICM for integrated catchment modeling and integrated modeling platform to incorporate urban and river catchments. It integrates hydrodynamic simulation techniques for modeling both aboveground and belowground elements of catchments.
The third major platform is InfoMaster, an ArcGIS-based management and capital planning software for water and wastewater networks. It uses state-of-the-art mathematical models to predict when a water or sewer pipe will fail, and offers solutions for correcting the problem. InfoMaster’s capabilities are demonstrated in this profile of the City of San Jose’s ongoing rehabilitation and replacement of its sewer system.
SAN JOSE REHABS SEWER SYSTEM
The City of San Jose’s Division of Transportation and Hydraulics Service is responsible for the city’s 2,200 miles of the sanitary collection system. It initiated a rehabilitation and replacement plan for its sewer system with a sanitary sewer condition assessment, including a 50-mile pilot project in 2010. It then chose Innovyze’s InfoMaster and its Decision Tree Model, according to Amanda Lei, a project manager in the division.
The division initiated its InfoMaster platform by making a copy of the GIS platform already on the division’s system and inserting InfoMaster in its computer system. It started filling the platform in 2014 with the information already existing on the division’s GIS platform.
Lei says, “Once we get information on a sewer pipe, we feed it into InfoMaster and it tells us how many pipe segments have to be repaired, where they are located, and a recommended repair or replacement and cost.” She says, “We have over 53% of the system assessed. That’s over 1,000 linear miles of the sewer system.” They expect to have 100% of the sewer system assessed by 2022. The city estimates it will take $45 million to repair the initial 322 miles that have been assessed, she says.
HOW ARE ASSESSMENTS MADE?
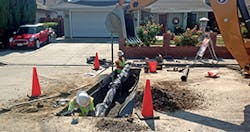
Sewer pipes are inspected with CCTV cameras inserted down a manhole into the sewer line and pulled by a cable through to the next manhole where it is extracted. Contractors do the majority of this work, says Lei. She illustrated what the camera might find: As it travels through 100 feet of pipe, it picks up three holes at 10 feet, 50 feet, and 75 feet. The camera also reports the geographic locations of each hole.
A pipeline assessment certification program coding system is used to code the defects spotted by the cameras. This information is entered in InfoMaster after making sure it’s clean, says Lei. ArcMAP, an option in ArcGIS, a product from Esri, a geographic mapping and software development company, automatically provides the location in InfoMaster.
The last CCTV assessment, in 2017, found 130 miles of pipeline that needed repairs or rehabilitation. InfoMaster then did a risk analysis of what was found and which lines should take priority. Lei says the division’s priorities are also added to the items on the list including funding priorities. Norman Mascarinas, senior civil engineer and section manager in the division, adds that sanitary sewer overflows always take priority.
HOW IS RISK CALCULATED?
InfoMaster calculates the likelihood of failure (LOF) for each sewer line based on the known aspects of the pipe including its diameter, age, and cleaning frequencies. It also calculates the consequences of pipe failure (COF), based first on location of that pipe in relation to waterways, plus the population density. For example, the COF of a sewer line in a remote area is considered lower than one in a metropolitan area near a hospital. The overall risk is a combination of the LOF and COF.
Once the higher risk sewer lines are identified, CCTV camera inspections are done in them to give the staff clear information, says Lei.
The Decision Tree Model produces recommended repairs; for the example cited above, it would recommend the three holes be patched. If the pipe is also cracked, or it sags, the recommendation will likely be to replace it. However, says Lei, there is always a human decision at the actual project level. “Part of the construction scope is to evaluate on-the-ground rehabilitation work.”
Another consideration when evaluating when to do repairs or rehabilitation is combining projects. The city’s service territory is divided into high-, medium-, and low-risk areas based on the age of the housing stock and sewer pipes and when they were installed. Identified high-risk projects are then bundled together given their locations in the risk areas.
A sign of the success of the division’s work is the reduction of sanitary sewer overflows, says senior civil engineer Mascarinas. In fiscal year 2011–2012, there were a total of 192 overflows. By fiscal year 2016–2017, the overflows had been reduced to 58.
PI TRACKS, ORGANIZES DATA
OSIsoft’s new Process Information System, or PI, introduced in 2017, captures and organizes the flood of data coming from a utility’s machines, pumps, valves, and hydrants. It then synthesizes the data, allowing staff to take action.
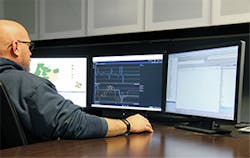
PI can accept any kind of data, including weather, from multiple sources, including SCADA, and merge it all together, says Michael Kanellos, senior manager of corporate communications and technology analyst at OSIsoft. A business can see, at the tap of a key, how much electricity it is using, how much gas is being burned, or how much beer a brewery is making.
As a water utility grows, it will generate and capture more data from sources like smart meters and embedded temperature sensors, transformers, and pumps. For example, Kanellos says Petasense or Setpoint have sensors that pick up vibrations on valves, motors, and pumps. These sensors can recognize the patterns in vibration that indicate that something can break or may be out of alignment. PI makes those patterns visible.
Petasense, based in Silicon Valley, formed a strategic partnership with OSIsoft in 2017. Setpoint is CMS software and hardware owned by Metrix. It established an Original Equipment Manufacturer (OEM) partnership with OSIsoft in 2014 to manage Setpoint data.
Flowserve, which makes large pumps, has added OSIsoft technology to the pump so that customers will be alerted much more quickly to changing vibration patterns and potential trouble, says Kanellos.
Kanellos says PI has the capability of tracking 10,000 to well over 1,000,000 data points, analyzing the data and visualizing it on any device. One pump may have multiple data points while one customer may have 27 million data points in his facility. PI Vision also allows individual users in the facility to design screen data to fit their needs.
The San Francisco Public Utility Commission’s Wastewater Treatment Center uses the PI System for visually diagramming a machine’s “equipment health,” says Kanellos. He describes it as “almost a point-and-click” system. SFPUC predicts it could save up to 9,000 hours of employee time a year by being able to reduce redundant or unnecessary maintenance rounds, he adds.
“We capture the data from their assets, bring it all together, and serve it up on the screen,” says Kanellos. “We can tell them the current state of water levels, weather reports, etc.” With that information, they can prevent accidental discharges into the bay (and the fines that go with it). SFPUC also uses it to predict maintenance failures. This way they only have to send out people when necessary.
Kanellos says a lot of tools that identify underlying problems are easier to use now than a few years ago. He points out that water utilities are sometimes the largest power users in their areas, consuming 30% of the electricity in a district. By monitoring water usage, the agency can save 6 to 12% with software that identifies problems and where they lurk.
OSIsoft is moving into cloud systems for smaller buildings, says Kanellos, with a product called XOMPASS. The data collected by PI flows to the PI system server. A small building with 1,000 to 2,000 data points and without a sophisticated IT department will be able to benefit from the cloud service.
WHITE HOUSE TACKLES WATER LOSS
The White House Utility District covers a 600-square-mile service area and has 34,000 meter connections plus one wholesale company with another 3,500 connections. It is headquartered in White House, TN.
The utility has had an ongoing struggle with non-revenue water loss and in 2012 it collaborated with Esri to tackle the costly issue. It has since reduced its non-revenue water loss from 32% in water mains to 27% or 28%. In the spring of 2016, it installed OSIsoft’s PI software platform to further identify leaks in its water distribution pipes.
The utility staff downloaded the needed software from OSIsoft’s data site and streamed it over a four-day period into Esri’s ArcGIS already on its system.
Carl Anderson, WHUD’s GIS director, says PI integrates time and space in his utility view. Prior to acquiring PI, a staff member collected manual data daily, calculating it and then updating the GIS, which took most of the day. Now, PI takes information from multiple locations, collects, cleans, and structures the data and sends it to ArcGIS automatically. He says this has saved hours of manpower and increased the data’s timeliness.
“We’re able to refocus on the district metered areas (DMAs) where potential leaks have already been identified,” and the freed-up staff can locate them precisely using ArcGIS much more quickly than before, Anderson explains. The utility had already installed Hydreka’s Hydrins2 insertion meters in the DMAs. These meters report the flow that goes through them. Now PI streams those flows and calculates increased or decreased flow, if it occurs, then updates ArcGIS, pinpointing the leak location automatically.
For example, Anderson, in a 2017 OSIsoft webinar, cited as an example the Lamont DMA. It has 571 connections and reviewing flow data, assumed it handled an average of 26 gallons per minute. “By automating the data calculations, we could see the DMA was losing $3,000 a day. We are managing staff and not data now,” says Anderson.
According to the OSIsoft case study, WHUD was able, in less than four days after installing PI, to locate a leak spilling approximately 147 million gallons a year, costing WHUD over $300,000 annually. Because the leak was in a rural part of the district, local residents believed it was a stream.
WHUD saved $400,000 in 2015 with ArcGIS and increased savings to $500,000 in 2016 when PI was added to ArcGIS. It was also able to recover $30,000 in employee time and productivity.